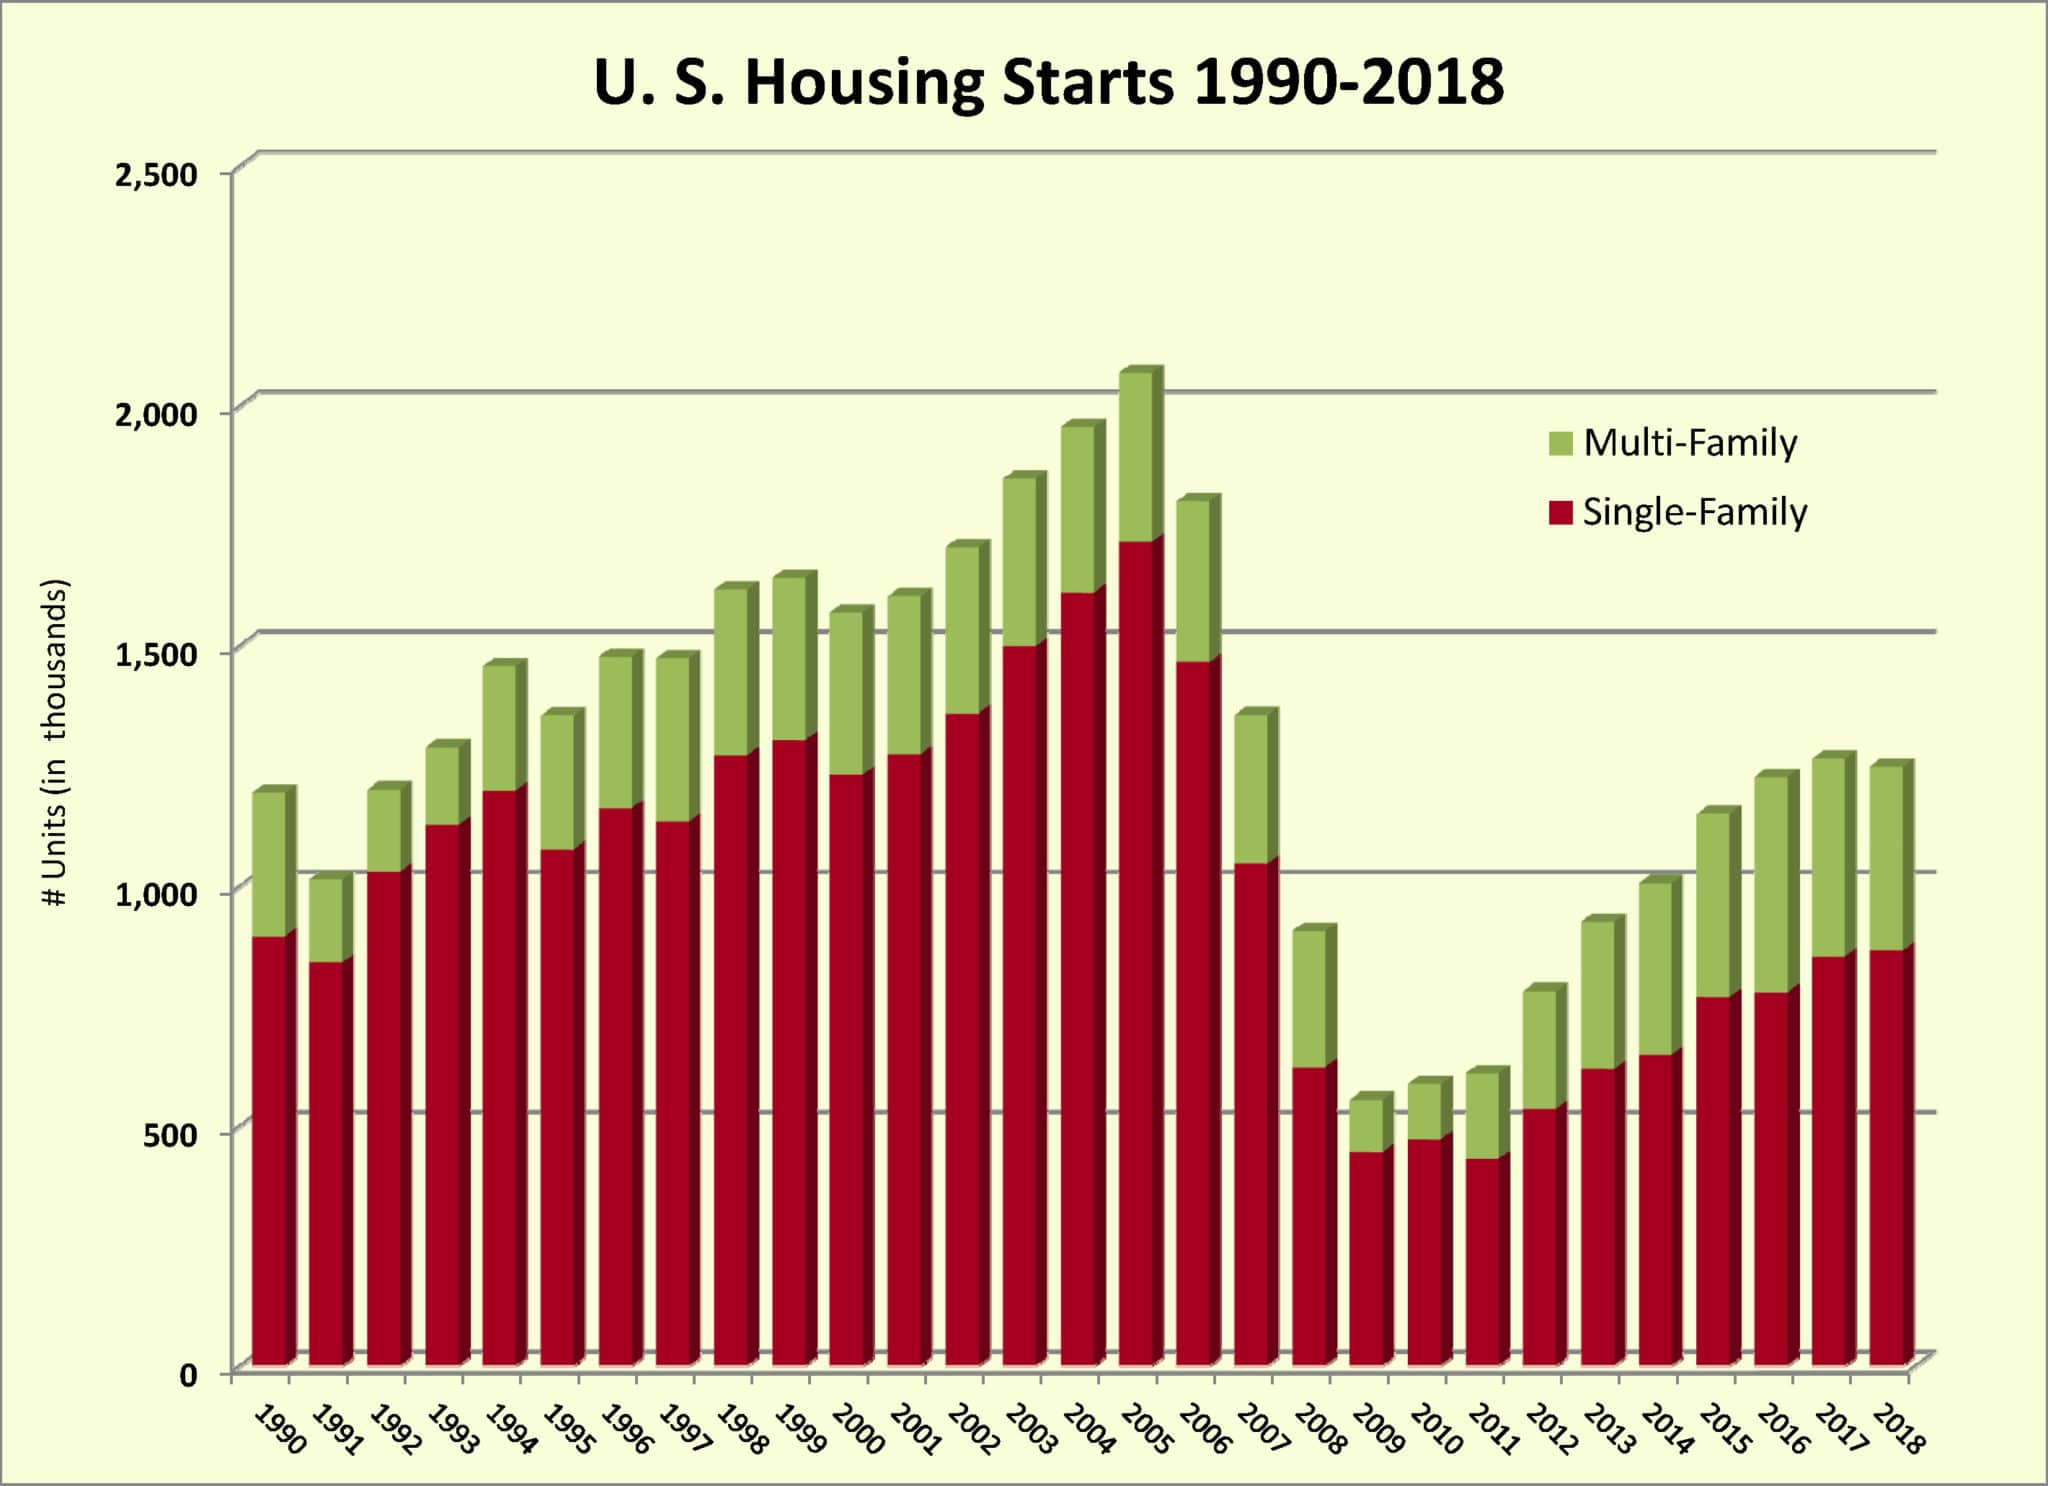
Construction led off an uneven week of reports on the U.S. economy, when the Census Bureau reported on February 26 that housing starts had fallen by 11.2 percent from November to December 2018. The seasonally-adjusted 1,078,000 units were 10.9 percent lower than in December 2017.
Reports on the mindset of the consumer were more upbeat. The Conference Board released its survey of consumer confidence on February 26 as well, and it showed a rebound following three consecutive months of decline. The reading of 131.4 was a dramatic jump from January’s reading of 121.7. The better frame of mind was attributed to the end of the federal government shutdown and the reduction in volatility in the stock market. It’s worth noting that, although consumer confidence sagged from November through January, the levels of confidence during those months were still very high compared to the survey’s history.
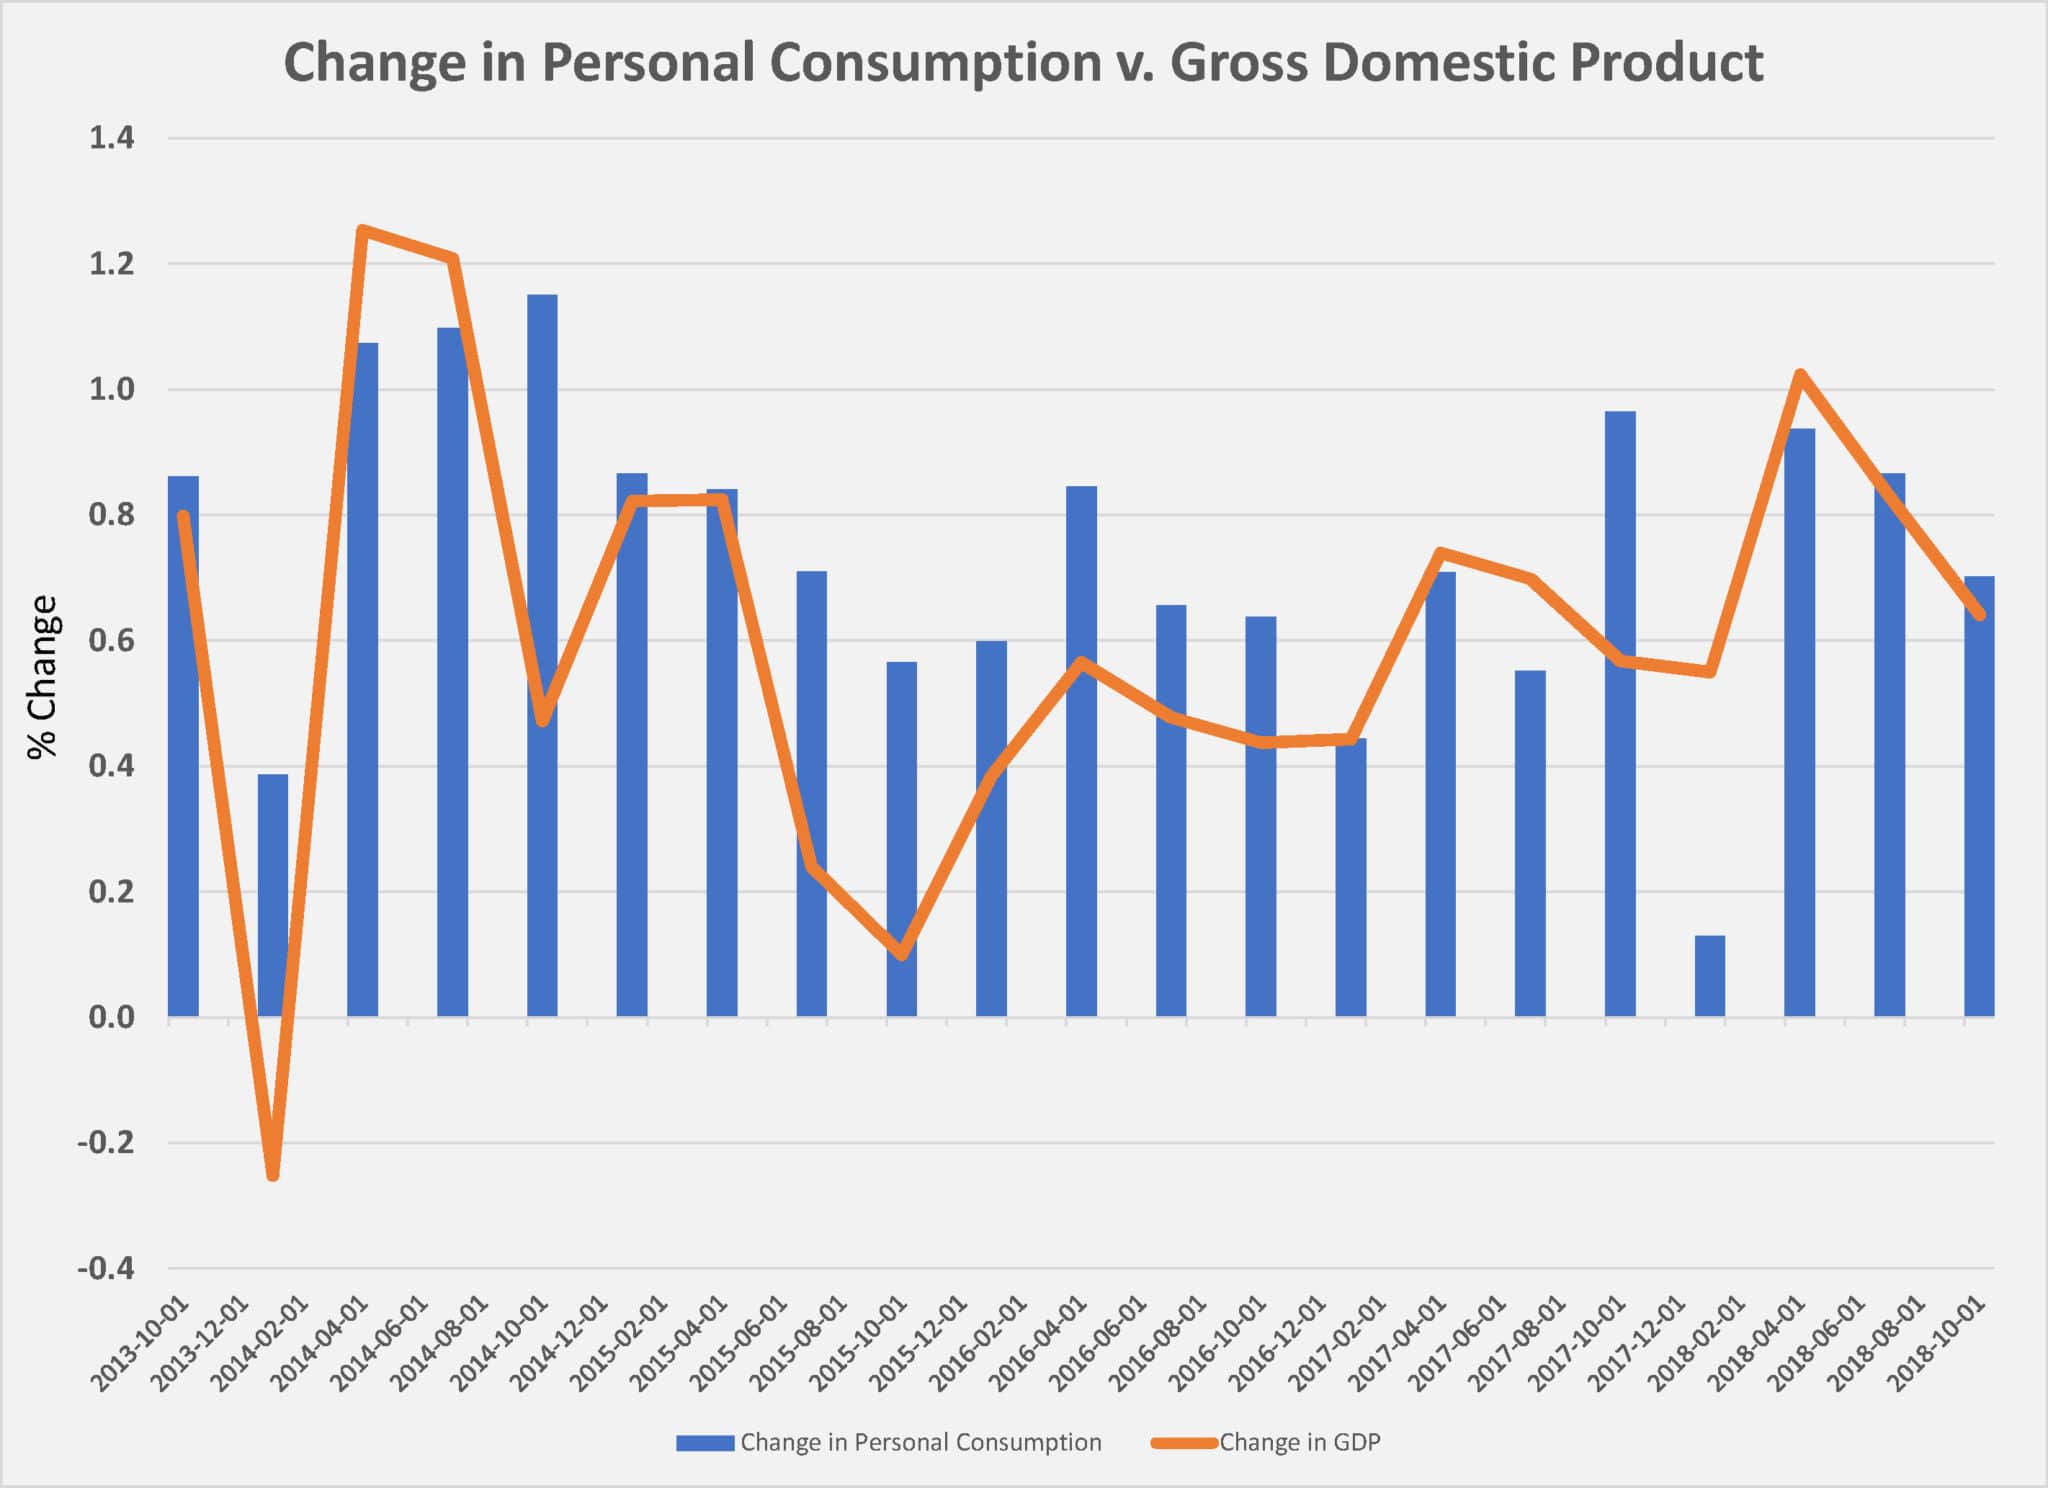
Data on consumer spending mirrored the readings on sentiment. The latest report on consumer spending showed a slight 0.5 percent decline in spending from November. Declines in consumption on cars and trucks, driven by year-end discounts, and on household utilities, a product of declining energy prices, were the main reasons for the lower spending. Unusual declines in prices, like those for vehicles and energy, can mask what will be otherwise normal spending patterns. That appears to be the case in December. Another interesting consumer data point that indicates a healthy consumer economy in December was the jump in personal savings rate from 6.1 percent to 7.6 percent. Personal income growth also jumped in 2018 to 4.5 percent, aided by tax cuts and a tighter labor market.
The decline in housing starts, although surprisingly steep, was explained somewhat by the perception of rising interest rates (long-term mortgage rates have stayed relatively flat) conveyed by the Federal Reserve Bank and uncertainty about the U.S. economy that surfaced during the holiday season. December’s slow volume of starts was also offset by a surprising jump in permits issued for new homes to 1.326 million units. Permits are reliable predictors of future starts and suggest that the December slump is temporary.
An estimated 1,246,600 housing units were started in 2018. This is 3.6 percent (±2.1%) above the 2017 figure of 1,203,000.
Taking into account input from homebuilders and real estate agents, it seems that the steady rise in the Federal Reserve’s Fed Funds Rate over the past few years had created the perception that borrowing costs were becoming less affordable. Coupled with the skyrocketing home prices in many markets, the perception of home affordability appeared to be taking a hit. The Fed Funds Rate, which is the interest rate member banks charge to lend overnight, has been moving higher while long-term rates, like the 30-year mortgage, eased upwards. Rates for a 30-year mortgage at year’s end were, in fact, no higher than in April 2014 and never topped five percent on average.
Businesses also expressed some concerns about rising rates, especially with regard to the impact on capital investment, in recent Beige Book surveys. Federal Reserve Chairman Jerome Powell addressed those concerns and his own comments in the December Open Markets Committee readout when he met with Congress in late February. Powell cited the slower growth rate of the U.S. economy and the controlled rate of inflation as reasons why the Fed decided to step back from its pace of rate hikes.
“When I say that we are going to be patient, what that really means is that we are in no rush to make a judgment about changes in policy,” Powell told the Senate Banking Committee. “We are going to be patient. We are going to allow the situation to evolve. I think we are in a very good place to do that.”
The Federal Reserve sees growth in gross domestic product (GDP) falling to 2.5 percent or slightly below in 2018.
The shutdown of the federal government is delaying many of the economic surveys and reports but the first estimate of GDP growth for the fourth quarter came in at 2.6 percent, according to the Commerce Department. The U.S. economy appears to have grown slightly less than three percent for the full year of 2018, as the March 1 report estimated that the shutdown trimmed 0.1 percent from GDP, leaving growth at 2.9 percent.
Growth in GDP was not the headline economic story for 2018. As it was in 2017, gains in employment and wages were the top measures of an economy that has expanded for a decade. The strong job creation in December resulted in an average monthly gain of 220,000, nearly 40,000 more each month than in 2017. Wage growth edged above three percent during the second half of 2018 and the robust labor markets appeared to have drawn more workers back into the market. In February 2019, job openings continued to rise, reaching more than 7.4 million compared to 6.5 million unemployed persons.
A further measure of the strength of the job market, the so-called “quits rate” – the percentage of people leaving jobs without another job – was at 2.3 percent. That was more than twice the 1.1 percent rate of layoffs by employers. The September 2018 quits rate of 2.4 percent was the highest since January 2001.
Employment gains in February continued the trend of accelerated hiring. The March 8 report by the Bureau of Labor Statistics found 212,000 new jobs were created last month. The unemployment rate was 4.0 percent.
Despite the solid economic growth, construction activity may not be as robust in 2019. Construction remains at multi-cyclical high levels, but the rate of growth is that of a mature business cycle. Economists who follow construction are in agreement that the volume of construction will outpace inflation, but only by a point or two. Construction spending growth estimates fall between three and five percent, with the latter relying on more optimistic scenarios that are likely to occur.
During 2018, construction spending overall remained in a tight range between $1.26 billion and $1.317 billion, with most months varying only a few hundred million dollars from the previous month. Total construction spending in December was $1.29 trillion, up 1.6 percent from the December 2017 totals. Within the major subcategories, public construction rose 4.2 percent year-over-year; private nonresidential construction was 4.0 percent higher than the previous December; and private residential spending declined by 1.3 percent, largely due to a decrease in single-family construction of 5.2 percent.
Two forward-looking indicators of construction activity also support the forecasts of continued growth for nonresidential spending.
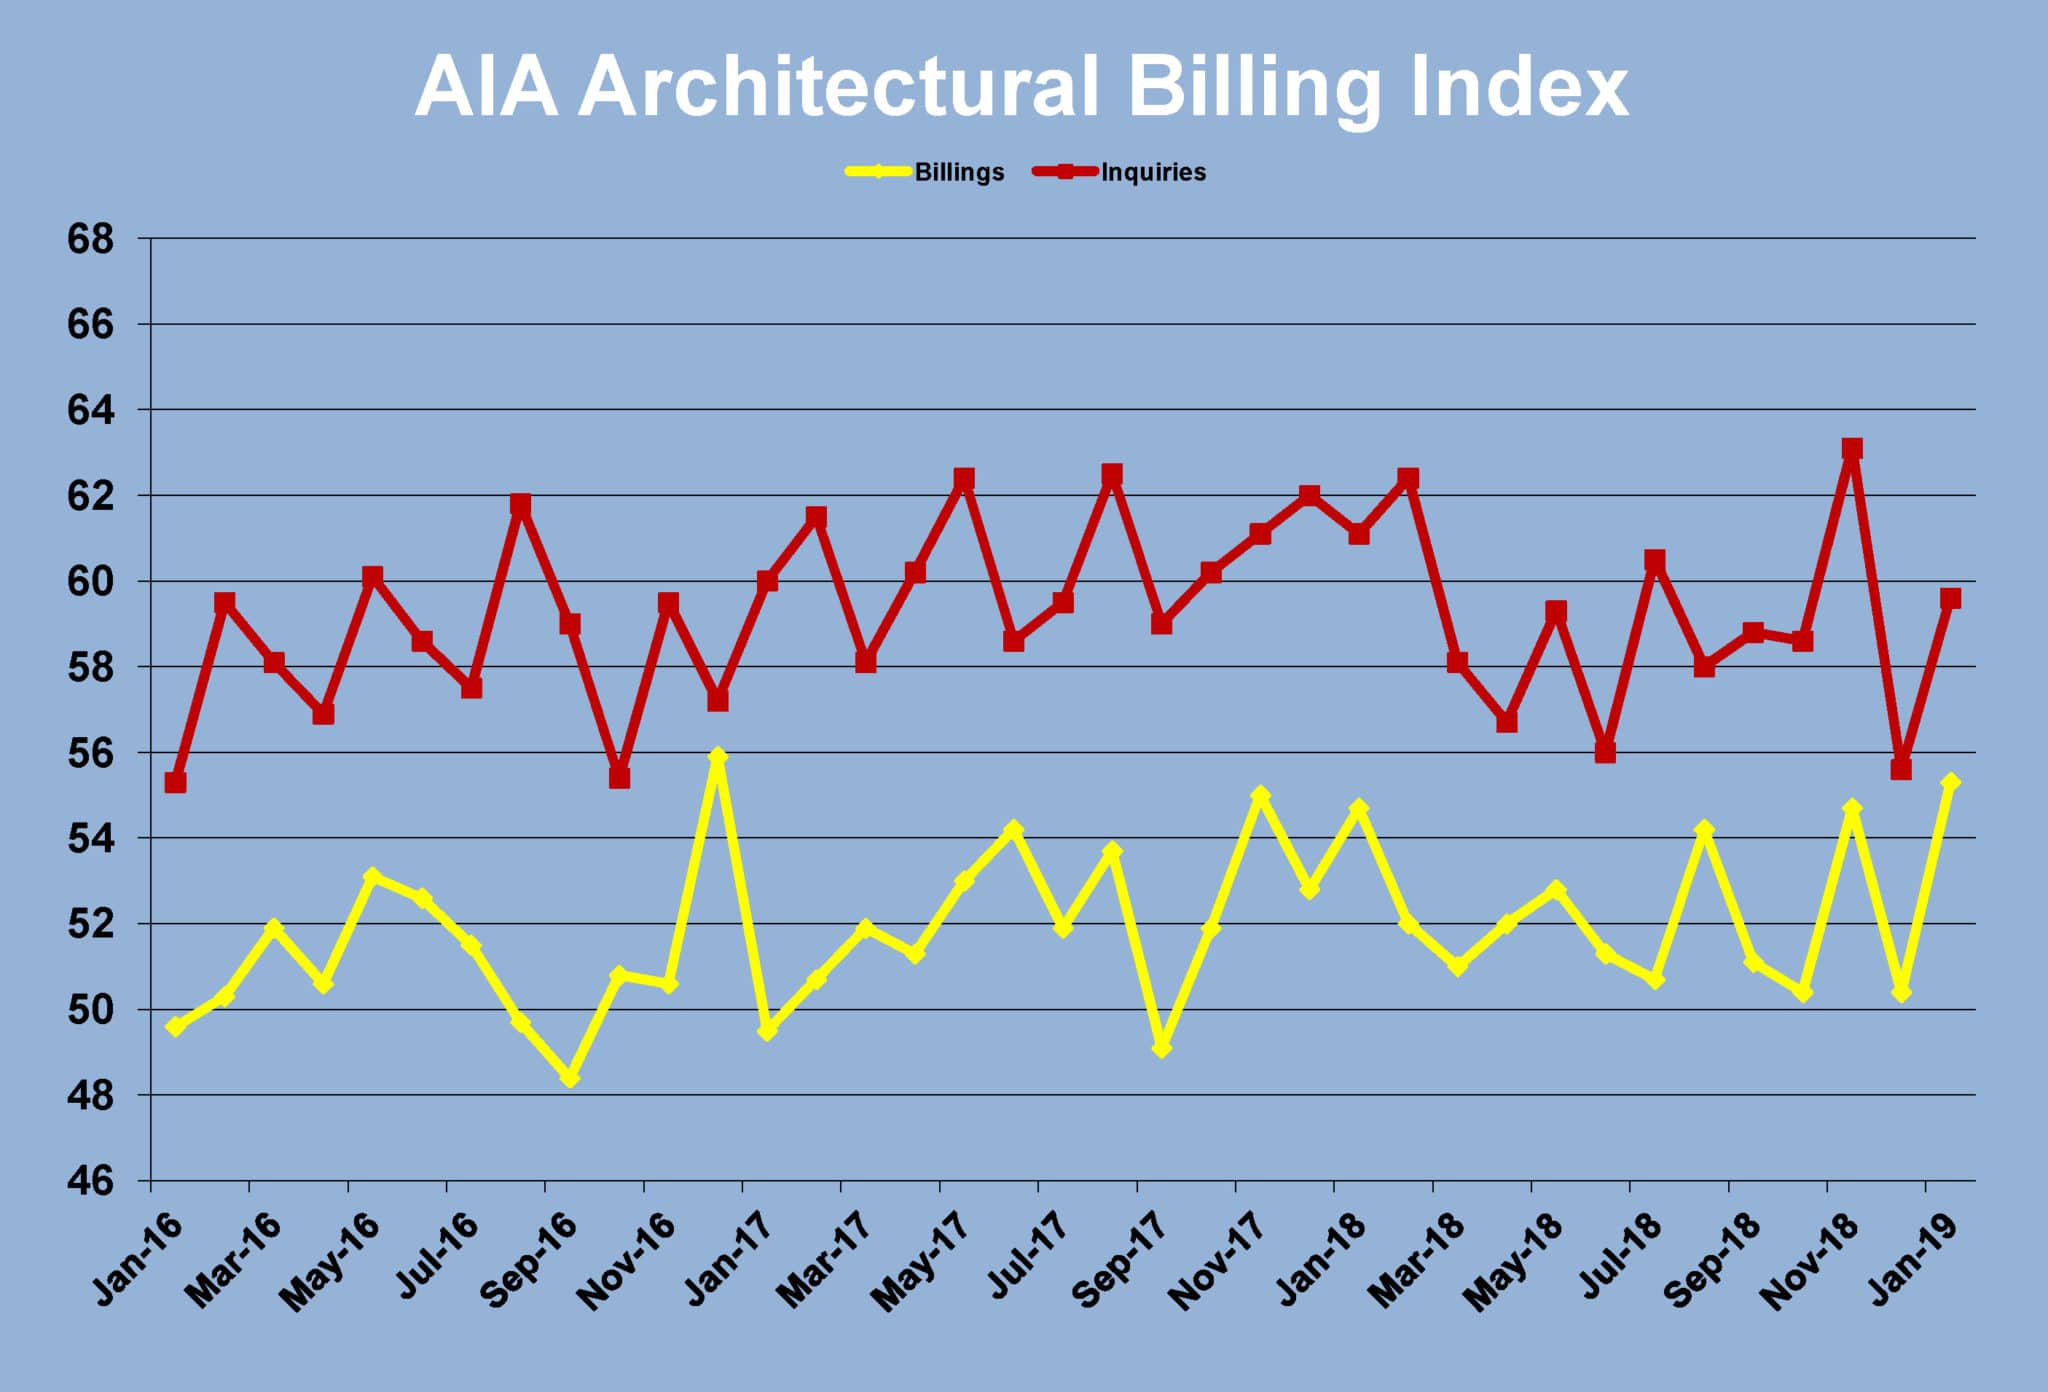
The final reading of architect’s monthly billings for 2018 was positive for the 15th consecutive month. The American Institute of Architects’ Architectural Billings Index (ABI) was at 50.4 for December, with inquiries at 55.6. A survey of firms asking whether billings were higher or lower than the previous month, the ABI has been above 50 (meaning there were more higher responses than lower) since September 2017. The index has registered below 50 only twice since September of 2016. ABI remained elevated in January 2019, jumping to 55.1.
The long-term trend for ABI is flattening but the continued positive reading indicates that construction will remain higher through 2019, assuming that the work on the boards at architectural firms comes to fruition.
Engineers surveyed reported a decline in outlook during the final months in the year, but an overall positive look forward at business conditions. The American Council of Engineering Companies (ACEC) reported that in its fourth quarter 2018 Engineering Business Index (EBI) was 58.5, a score that was well above the neutral reading of 50. The fourth quarter responses were a sharp decline from the 66.3 score of the third quarter. A measure of market confidence, the fourth quarter 2018 EBI reflected declining outlooks for buildings and land development and continued confidence in transportation and water and wastewater.
Taken as a whole, the data and confidence indicators for the U.S. construction economy are positive, particularly for the age of the business cycle. It’s clear that a tight labor market is constraining economic growth, although there is insufficient data to judge the degree. Rising interest rates seem to have chilled demand slightly, but buyers and developers are likely to adjust to the small increase in actual borrowing costs, especially now that the Fed has signaled an end to the regular rate hikes. Declines in investment in all categories of structures during the fourth quarter, therefore seem temporary. The case for another year of three percent growth in construction seems much clearer than the case for a decline.