The pessimism that accompanied the December 2018 15 percent stock market correction faded by the end of the first quarter of 2019. While the underlying data suggests that first quarter gross domestic product (GDP) growth will be slower, fears that the U.S. economy is on the verge of a pullback are unfounded.
GDP growth for the full year 2018 came up just short of three percent. The 2.9 percent year-over-year pace was the best since 2015. Boosting growth was the windfall from the 2017 Tax Cut and Jobs Act and improved business investment, particularly during the third quarter. Significantly lower exports and weaker consumer spending, especially during the fourth quarter, dragged on GDP. First estimates of GDP for the first quarter of 2019 were still lower, coming in at 1.8 percent, but consumer spending and business activity during February and March point to a second quarter rebound. The consensus of economists still points to GDP growth in 2019 that will be in the 2.5 percent range.
Signs of strength in the global economy are also easing concerns about a downturn in the near term. BCA Research, which tracks and creates the Leading Economic Indicators (LEI) index worldwide, reports that the index continues to slip toward no growth in the first quarter; however, BCA also sees stability in the index’s trend. A diffusion index of the LEI finds that more countries are improving towards growth than decline, even though the overall index fell slightly.
Job creation remains the most supportive data point for the economy. After a disappointing addition of 33,000 jobs to U.S. payrolls in February, the Bureau of Labor Statistics reported gains of 196,000 in March and 157,000 in April. The rolling 12-month average of 203,000 jobs created monthly are on pace with the high-growth years of the late Obama Administration, and the Trump Administration has signaled that maintaining employment gains is a high policy priority. Just as important was the year-over-year 3.2 percent gain in wages, an increase that gives workers roughly twice the rate of inflation.

After witnessing the strong negative reaction to its December rate hike, the Federal Reserve Bank has been signaling more reluctance to raise rates in the near term, or even at all in 2019. Most economists have baked a late-year 25 basis point increase into their forecasts for 2019, but a majority of Fed regional presidents have spoken publicly about remaining watchful of the rate of core inflation as an indicator. With inflation falling to below the Fed’s two percent target, the imperative to increase rates has eased.
With the cycle of regular hikes to the Fed Funds rate seemingly ended, there is anticipation that the decline in long-term interest rates will breathe life into the housing market. That would be consistent with a demand-driven forecast for home sales and construction, but the housing market is being constrained, at least in part, by supply-side issues.
Residential construction sees more volatility in its monthly data reporting than nonresidential in any business cycle. The shorter duration of the construction cycle, especially in the southern and western regions of the country, means that a minor delay that throws new construction into a different month can skew the start and put-in-place numbers significantly. In the current market conditions, well into a long tepid residential real estate recovery, that volatility is more pronounced. It’s more instructive to look at the market quarter-to-quarter or on a rolling 12-month average basis.
Both new construction and existing home sales have see-sawed back and forth in the past two quarters. What has been consistent over the past 18 months, however, is the declining mortgage volume. A large part of that decline has come from the exhaustion of the refinance market. But the number of new mortgages is also off slightly. U.S. households are in strong fiscal condition but the inventory of homes to buy is lower than normal, leading to fewer transactions and fewer mortgages. Delinquency on mortgages remains low as well, which makes a recent move by the Federal Housing Administration (FHA) curious.
The agency revised its loan standards for 2019 to include a minimum credit score of 500. FHA also created a tier of mortgages that would require a ten percent down payment if the applicant’s credit score was below 580. The standard FHA equity level is 3.5 percent. This change addresses borrowers in the category that was addressed (catastrophically so) by the sub-prime mortgage market in the mid-2000s. Sub-prime mortgages were the kind that sunk the residential mortgage-backed securities market when foreclosures began spiking in 2006 and 2007.
What makes the move curious is the overall credit performance of FHA’s government-backed portfolio. Delinquency and loan defaults on FHA loans tend to be slightly higher than the overall mortgage market but the current levels aren’t trending higher, despite reporting to that effect. While 10.26 percent of the FHA portfolio is past due, only 2.3 percent are delinquent greater than 90 days, and only one percent are in foreclosure. Moreover, the share of mortgages past due has fallen from 12.21 percent in 2014 to 6.77 percent in 2017 and 2.46 percent in 2018. Delinquency tends not to occur as often in the first few years of indebtedness but the number of past due loans are not rising relative to earlier norms.
FHA’s underwriting standards don’t drive the market in the same way that Fannie Mae’s standards do since the latter essentially dictates what the secondary market can buy. However, this specific tightening of standards will have a negative impact on younger buyers, who have already seen lower levels of home ownership.
The lagging demand for home ownership from the Millennial generation is one of the reasons for the uneven performance of the U.S. housing market. While lot inventory is insufficient to fuel stronger growth in new construction and higher levels of existing homes for sale, hot demand from the first-time buyer cohort would create incentives for developers to solve the problems that are limiting supply. Absent that high demand, builders and developers are maintaining the current trend of low growth, rather than extending the risk of overbuilding.
Low growth in single-family home construction should help support the multi-family market, as the pace of household formations continues to grow. The recent months’ data on housing starts shows that the household formation rate is keeping apartment construction from sliding.
Housing starts data may be less reliable during the first half of 2019, as there is fallout from the month-long government shutdown on the collection and verification process. Through February and March, permit information appears to be running closer to the long-term trend, suggesting that permits may be a better indicator of housing construction in 2019. Permits, which require less verification and research, are a good indicator of start activity in the months that follow. Thus far, permits are showing new construction at the 1.2-million-unit pace, with between 800,000 and 850,000 new single-family units approved (although March starts dipped to 785,000). Data on multi-family permits and starts have been slightly elevated at between 350,000 and 400,000 units. Construction of multi-family units has been within that range quite consistently since January 2013.
Wells Fargo Securities presented a sanguine outlook for the nonresidential construction segment for 2019 in its March Commercial Real Estate Chartbook. That forecast seemed to draw primarily upon data that represented the market’s potential, like the AIA’s Architectural Billings Index (ABI) and the relatively modest level of investment in nonresidential structures during this business cycle.
The former tends to be a reliable indicator of construction activity nine months to a year hence, as the ABI measures growth in activity by billings month-over-month. With ABI above 50 for the 25 months (before falling to 47.8 in March), and inquiries remaining at or above 60, the construction activity that follows design is likely to keep growing. The latter indicator, investment level, is less reliable as a predictor.
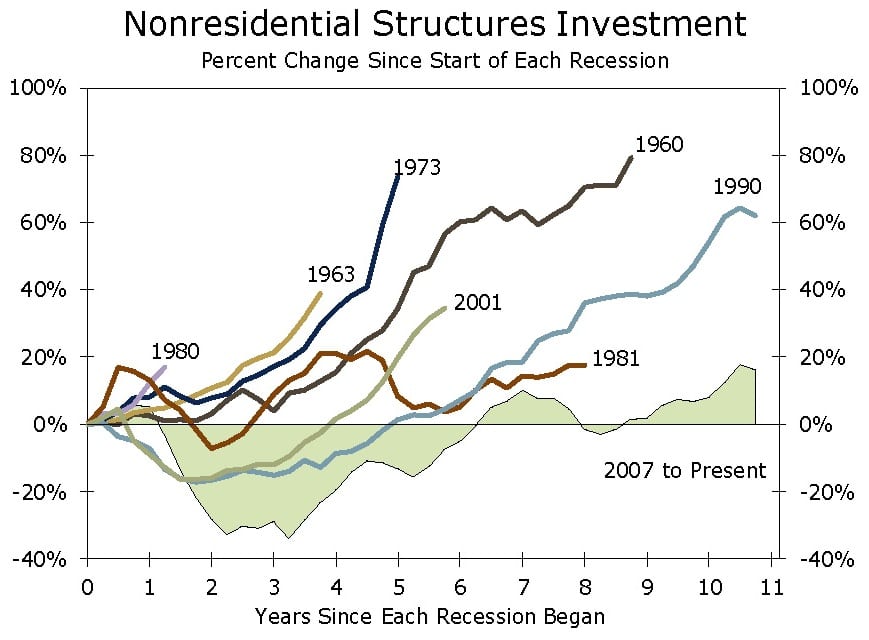
Two things jump out from a comparison of nonresidential investment growth in the current business cycle to cycles going back to the 1963 recession. The first is the duration of the recovery that began in spring 2009. Assuming GDP remains positive in the second quarter, the current business cycle will become the longest recovery period in U.S. history. The second observation is more relevant to the 2019 forecast. By a wide margin, the level of investment in nonresidential construction fell further than any of the other business cycles and has remained more muted. The cumulative growth of the expansion cycle of 2009-2019 has been 48 percent. At the peak of the 2001 cycle, investment in nonresidential structures was up 81 percent cumulatively. The 1990s expansion saw investment grow 75 percent cumulatively. Wells Fargo economists see this lagging level of investment as an indication of further upside, but the low level of investment may also simply signal less confidence and less public intervention.
Cushman & Wakefield also sees a comparison of the current cycle to previous cycles in office construction as potential for continued expansion. The commercial real estate service company sees the underlying health of the private sector economy as a strong driver of demand for space, particularly as the tech sector adds more jobs. New office construction during the current cycle peaks pales in comparison to the volumes of the previous two cycles. The 54.7 million square feet (MSF) added in 2017 was 56 percent lower than the 124.5 MSF built in 2001, and 29.1 percent lower than the 2008 peak. Cushman & Wakefield forecasts an increase in construction in 2019 to 64.4 MSF.
This lower level of new construction has also changed the makeup of the office market, Cushman & Wakefield found. Only 34 percent of the U.S. office inventory is less than 20 years old, leading to the conclusion that property owners had “under renovated” lower-class buildings during the past ten years.
Barring an unexpected hiccup in the employment market, the untapped potential in office development – along with the continued strength of logistics-driven industrial development –brighten the outlook for private nonresidential construction in 2019. With interest rates falling back again since year end, the market’s potential should find investors seeking long-term yield.
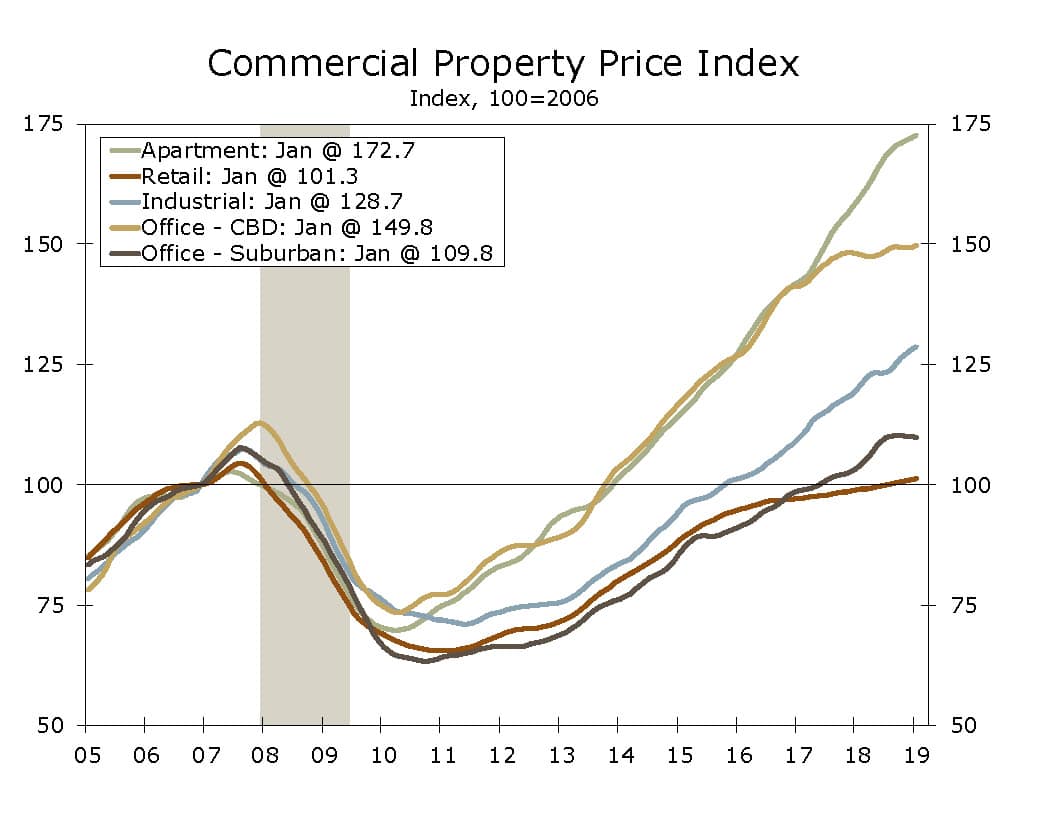
Commercial real estate investment in nonresidential structures has matched or exceeded that of most previous cycles. In fact, a look at the property values for commercial buildings shows that investment interest is high. All categories of commercial property have outstripped the value of commercial real estate at the peak of the last expansion in 2006-2007, with apartments reaching 172.7 percent of that period. Absent any meaningful inflation, the rise in value indicates strong investment. What has been missing compared to previous cycles is government investment. Previous recessions were met with state and federal investment programs that included public buildings. The Great Recession resulted in massive declines in state and local revenues, which limited or eliminated their ability to stimulate construction. The only federal construction program, the American Reinvestment and Recovery Act of 2009, focused on infrastructure instead of vertical construction.
Given the fiscal health of the government, and the prevailing aversion to increasing revenues through taxes or fees, it is difficult to envision a meaningful program getting through Congress or state houses that would result in a meaningful increase in nonresidential building investment.
Even without a meaningful boost in government spending, construction activity remains near all-time highs, although March marked six months below $1.3 trillion. March’s $1.28 trillion continued the trend. Well into a decade of increased spending, the forecast of three percent growth in construction for 2019 looks solid. Likewise, the long-term trends for the share of private construction and nonresidential construction have held in tight ranges. Nonresidential spending peaked at $781 billion in March and remains at around 60 percent of the total construction activity. Private sector investment was 75 percent of the total in February and March, a share that is at the high end of a long-term trend that has seen public construction make up 30 percent or less of the market since 2010.