The first reading of gross domestic product (GDP) growth during the third quarter of 2020 showed, as expected, a strong snapback from the pandemic-induced 31 percent decline in quarter two. This increase, along with measurable improvements in the outlook for the COVID-19 outbreak (increased infections notwithstanding), are prompting most economists to expect a return to the GDP output of January 2020 by the end of the third quarter of 2021. That forecast, if accurate, would mean a relatively quick recovery from the deepest recession of the last 100 years.
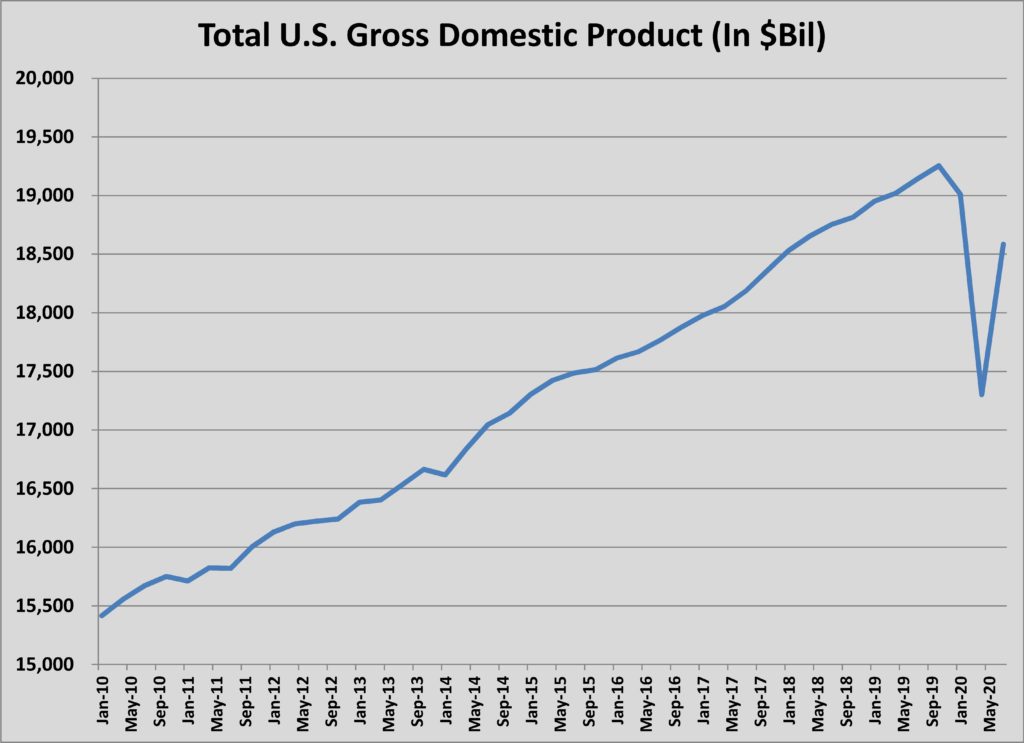
Third-quarter GDP growth was driven primarily by a 40 percent increase in consumer spending and a 50 percent jump in residential investment. The importance of the recovery of the U.S. consumer is the main reason for concern about the passage of another stimulus package by the end of 2020. Data from the Federal Reserve Bank of New York shows how the $1,200 check from the CARES Act worked to solidify the floor under the economy: 29 percent spent the payment by June 2020; 36 percent saved the money; 35 percent used the check to pay down debt. As long-term unemployment benefits begin to expire for the first of the unemployed on December 31, further measures to boost the consumer will avoid a slowdown in the recovery. There were warning signs for the economy as the quarter wound down.
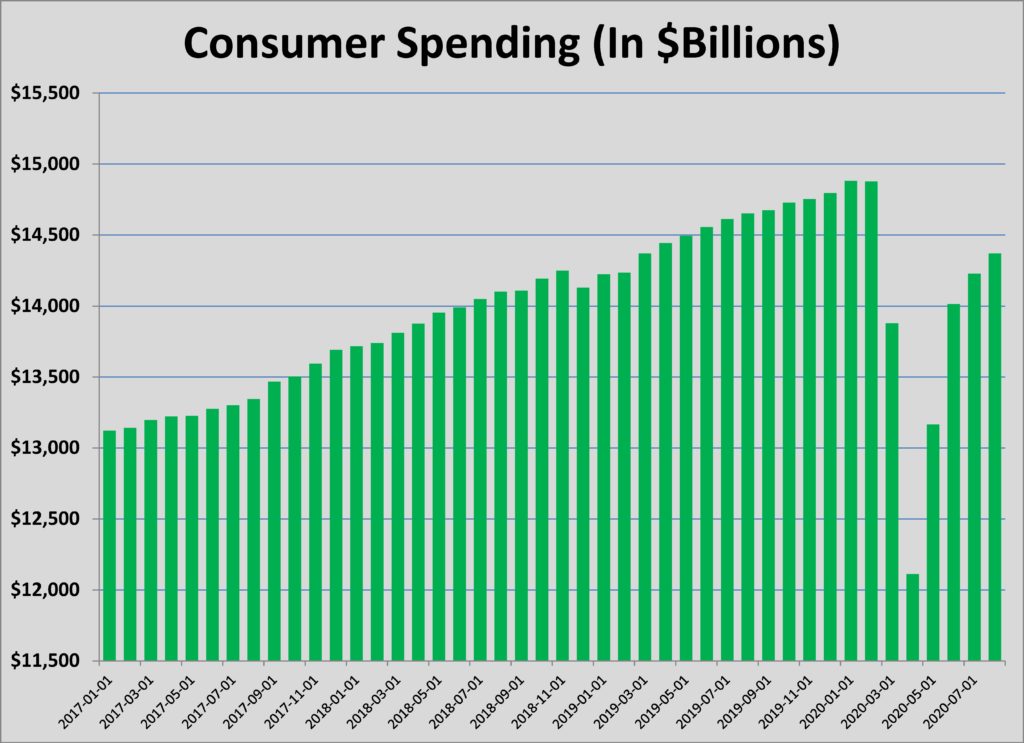
Source: Department of Commerce, Federal Reserve Bank of St. Louis
The Census Bureau’s Household Pulse Survey reported that 16.2 percent of all adults had not yet caught up on rent as of the end of September and 14.9 percent reported that eviction was “very likely” in the next two months. The survey also found that 32 percent of adults were having difficulty paving usual living expenses.
Economic data from the beginning of October revealed the slowing momentum of the U.S. recovery, as an uptick in COVID-19 infections in Europe and Asia provided a warning about the coming of flu season. The reports highlighted a few key areas of weakness in the economy, showing that the end of the federal aid programs for businesses was leading to more layoffs and threatening a cascade of financial problems for unemployed workers.
The most widely awaited report, the September Employment Situation Summary, was the last jobs report before the November 3 election. As expected, the October 2 report reflected slowing job growth. Employers added 661,000 jobs in September, a decline of more than 800,000 from August’s number. Economists had widely varied expectations of job creation, with forecasts ranging from 400,000 to 1.2 million new jobs. Based upon the stubbornly high unemployment claims numbers – 837,000 people filed initial claims the week before the jobs report – most observers predicted that September’s job growth would not exceed 800,000.
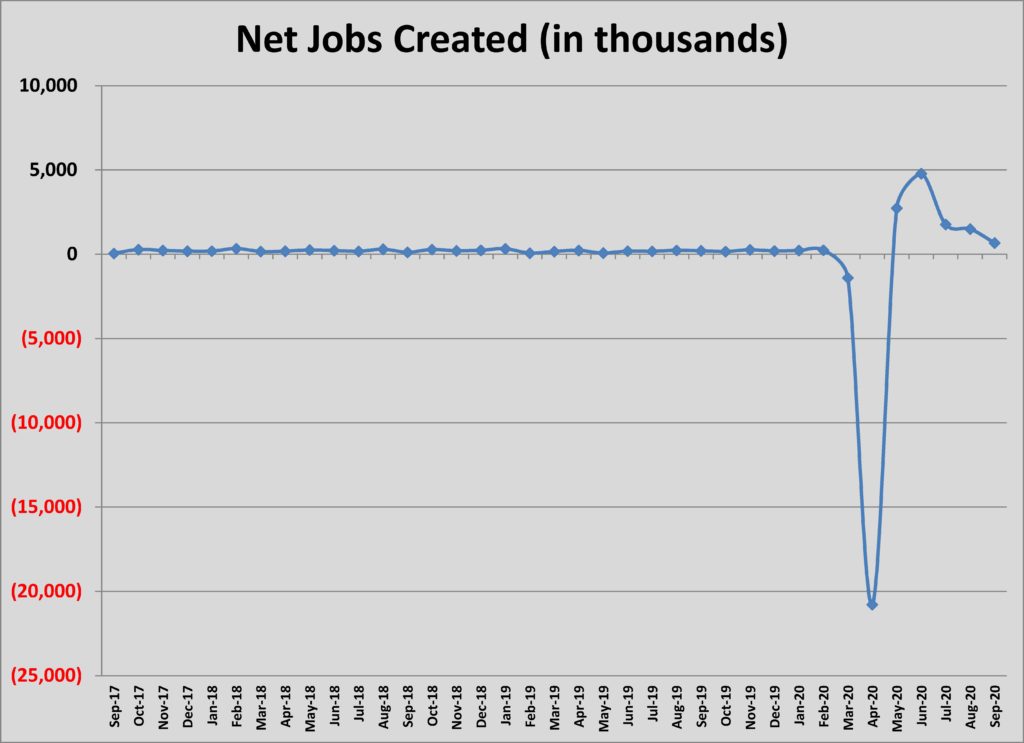
Source: U.S. Department of Labor
Unemployment fell in September, but that was not good news. Headline unemployment fell from 8.4 percent in August to 7.9 percent in September; however, the decline was primarily a result of 1.08 million workers dropped out of the workforce. One especially concerning note in the workforce participation decline was the fact that 865,000 women left the workforce, an indication that the lack of childcare options and uneven school reopening forced working mothers to opt-out of work. Other troubling signs were the 48 percent increase in those who have been jobless for 27 weeks or more and the slow decline (24.6 percent) in the number who have been unemployed between 15 and 26 weeks. As of September 26, 11.8 million workers had been unemployed for at least two consecutive weeks. Without further unemployment compensation adjustments, it is estimated that millions of workers will lose unemployment benefits each month beginning January 1.
In spite of the stalled economic recovery, there have been upside surprises that bode well for 2021. Unemployment, for example, has been lower than was feared at this point in the crisis. As documented above, it is still possible that the trend in hiring could reverse or slow further and unemployment could rise as companies shed workers kept on the payrolls by stimulus measures. In June, however, there were as many forecasts predicting double-digit unemployment by year’s end as were predicting unemployment at current levels.
Those higher unemployment forecasts were one of the main drivers of the predictions of skyrocketing evictions in the second half of 2020, forecasts which have happily been wrong. Forecasts from the latter part of the shelter-at-home period ran as high as 20-to-40 million renters being evicted this year. Instead, renters are on pace to experience a record low number of evictions in 2020. Eviction filings since mid-March have plunged 67 percent from normal levels in the 17 markets tracked by Princeton’s Eviction Lab, for example. Evictions plummeted even in cities without eviction bans. All reliable sources show renters are continuing to pay their monthly rent at near-normal levels.
Another upside surprise was the early data on fall enrollment at colleges and universities. According to the National Student Clearinghouse Research Center, enrollment in higher education was off 2.5 percent for fall 2020. That’s not far off the pace of structural decline that colleges and universities were experiencing pre-COVID-19 and far better than was feared just a few months ago. The data, which came from 22 percent of the institutions reporting by late September, found that the largest drop was in international students. Enrollment of foreign-born students had been slipping in recent years due to the anti-immigration shift in politics. The combination of travel restrictions and fears of infection accelerated the trend so that 17 percent fewer international students have enrolled in U.S. colleges. This trend has hit graduate enrollment hardest. Public four-year undergraduate enrollment saw the least impact, falling only 0.4 percent.
America’s higher education institutions continue to face financial stresses from the pandemic, which will have a dampening effect on capital spending in the short-term; however, upbeat news on enrollment is a welcome respite.
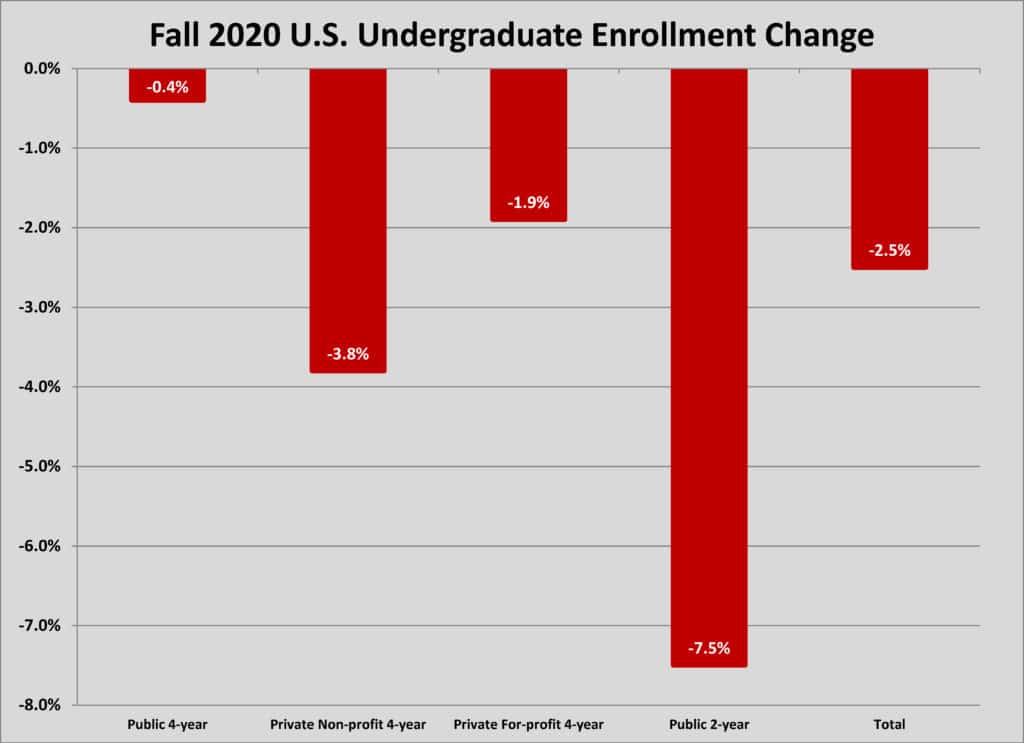
Source: National Student Clearinghouse Research Center
Perhaps the best news for the construction industry remains the nation’s housing market. Data on housing prices defies the overall downturn in the economy. While price appreciation has been driven by an ever-constricting supply of homes for sale, the rally is now being pushed higher by pent-up demand that is responding to record-low interest rates. Cautious Millennial renters have reached life events, like marriage and child-rearing, that typically spark homeownership later than earlier generations and are seeing the low cost of borrowing make ownership cheaper than at any time in U.S. history.
One of the housing market’s leading indicators, the National Association of Realtors’ (NAR) Pending Home Sales Index, reflects this unleashed demand. The NAR’s September Pending Home Sales Index was 132.8, up 92.5 percent from the April low. That index bodes well for the market, as it tends to predict closed sales by 60 days. NAR’s most recent sales data showed that existing homes sold were up 10.4 percent in August year-over-year and sales prices were up 24.2 percent.
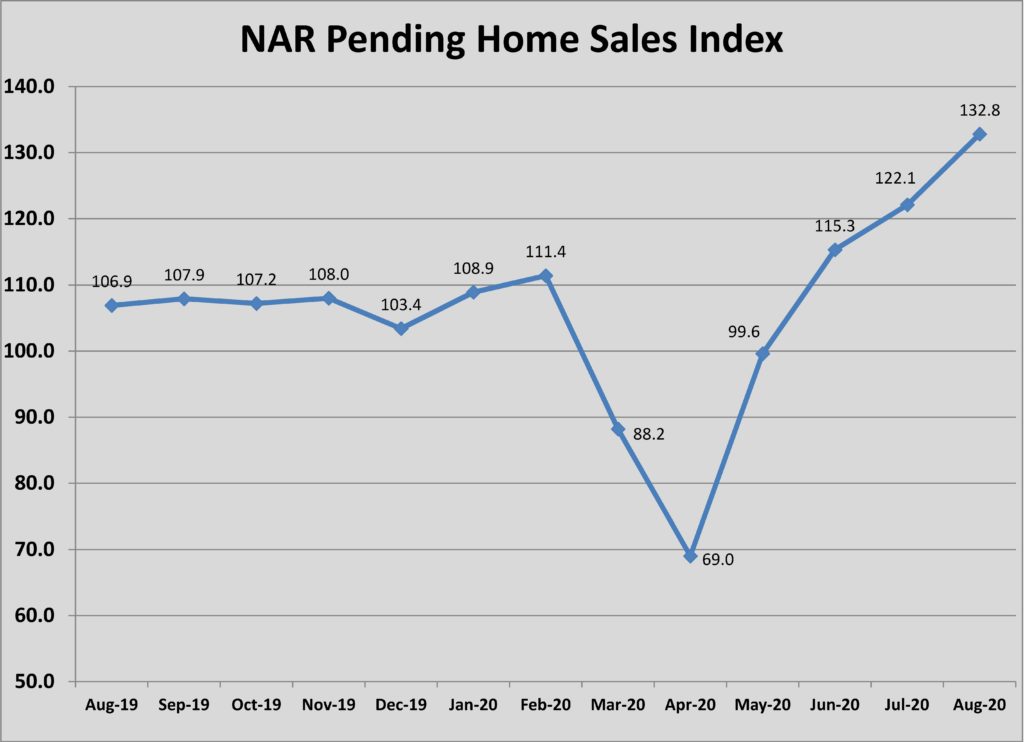
Source: National Association of REALTORS.
Residential construction is reflecting the increased demand. Housing starts in August were at a seasonally adjusted annual rate of 1,416,000 units, of which 1,021,000 were single-family homes. Total housing starts were slightly lower than the July rate of construction, but 2.8 percent higher than the number of units started in August 2019. Multi-family starts totaled 375,000 units in August. That was a steep decline from the 503,000 units started in July, but right in line with the five-year average of 373,000 units.
Multi-family construction remains solid in the face of the pandemic because demand has persisted and the financial case for development has eroded very little. Rents have slipped but not so much as to make projects unfeasible. A national apartment rent report from Apartment List shows that rents declined in 41 of the top 100 markets in the country since the onset of the pandemic in March. San Francisco, New York and Seattle have seen the steepest decline in rental rates. Nationally, rents have decreased 1.4 percent in 2020. Evidence in September suggests that the rate of decline is slowing and 59 of the 100 largest markets saw slight increases. The September shift in trend does not appear to be significant enough to alter the course for the full year.
Total construction spending in August rose to $1.412 trillion, according to the October 1 report from the U.S. Census Bureau. That level of spending was 1.4 percent higher than in July and 2.5 percent higher than August 2019. Nonresidential construction accounted for $814 billion of the total activity, a decline of 0.7 percent from one year earlier. Variances in spending for private versus public construction remained insignificant year-over-year, suggesting that significant revisions may be forthcoming post-COVID. Estimates of new contracting were not available but anecdotal evidence suggests that backlogs are not being built to levels that will support the same levels of construction in the first half of 2021.
One of the more reliable leading indicators of construction activity is, of course, design activity. The best indicator of where design demand is going is the American Institute of Architects (AIA) Architectural Billings Index (ABI), a monthly survey of AIA member firms that is a binary check of whether several key metrics are increasing or declining. A reading above 50 means more firms are seeing increased billing than declining. As could be expected, the ABI plunged in late spring, with the billings index falling from 54.3 in February to 29.5 in April.
The ABI was been stuck at 40 from June through August, although the index climbed to 47 in September. That’s a bad sign for contractors for 2021. Given the lead/lag relationship between design and construction, architects should be busy through the summer months if there is going to be an active bidding environment to build backlogs for the following year. Given the abrupt nature of the shutdown/slowdown that has followed the COVID-19 outbreak, it’s likely that many projects in the construction document stage in spring have not advanced.
On a positive note, the August and September ABI showed that project inquiries had increased above the breakeven point, with a reading of 51.6 and 57.2 respectively. Inquiries had fallen similarly in March through May. The rebound in inquiries sets the stage for what should be increased billings later this year. For those looking to read the tea leaves, it’s worth noting that the ABI for inquiries first recovered above 50 following the financial crisis in March 2009, which was the month generally regarded as the beginning of the ten-year-long expansion.