After a roller coaster of a year in 2020, the U.S. economy enters 2021 with the first signs of certainty about future demand since 2019. While it is still possible that the medical solutions to COVID-19 will be less effective or slower to roll out, and U.S. monetary and fiscal policy is less stimulating than necessary, economists are reaching consensus about the direction of the economy in 2021. As the effective vaccines are distributed throughout the winter, the rate of transmission of the virus begins to slow dramatically, particularly once warmer weather allows for more outdoor social activities. The economic stimulus and safety net allows consumers to stave off mass evictions and foreclosures, and business failures are minimized. This scenario, or some reasonable facsimile, restores more normal economic activity each month. A robust recovery gets underway after the second quarter, leading to a strong construction market going into 2022.
Of course, the fly in the ointment to this upbeat scenario is the response to the expected increase in hospitalizations and infections during the 2020 holiday season. How well the population responds to what should be the final stages of the pandemic will determine how much damage is inflicted on the economy.
The surge in hospitalizations led to mitigation steps similar to those taken in the spring of 2020, but the economic recovery that is expected to follow the rollout of vaccines has boosted the outlook for commercial real estate. The pandemic put a severe dent in demand for commercial space and raised questions about the future demand for office space, but signals from the key capital markets suggest that lenders anticipate demand to return to normal levels as the year unfolds.
CBRE released its report on commercial real estate capital markets during the critical third quarter 2020 recovery and the results showed activity that was already shifting to normal. Underwriting became more conservative, as expected, during the third quarter. Among the key underwriting conditions surveyed, average loan-to-value ratios declined to 61.5 percent. That was 5.7 points lower than a year earlier. Debt service coverage ratios expanded year-over-year from 1.38 to 1.59 during the third quarter. Neither of these shifts appeared to dampen demand.
Another positive sign was the return of a balance of capital sources. While banks originated 70 percent of the loans during the second quarter, banks’ share of the market fell to 39 percent from July through October. Life insurance companies originated 22.5 percent of loan closings during the third quarter. Commercial mortgage-backed securities increased the number of loans closed to $10.4 billion, although that pace is roughly 30 percent lower than the volume in 2019. Alternative lenders, like REITs, debt funds, and finance companies, re-emerged after nearly shutting off the flow of financing in the second quarter, closing 34 percent of the commercial real estate loans from July to October. These lenders are primarily sources of bridge and construction lending.
The future of the office market has been debated to death during the duration of the pandemic, generally to no conclusion. One conclusion that can be drawn is that work from home is bad for central business districts (CBD). Changes that work from home may bring to the urban office market will unfold as leases expire and/or are renegotiated. The dramatic reduction in daily occupancy that has occurred since March had already made its impact on real estate properties that are dependent upon CBD occupancy. That impact is pronounced for hotels and apartments.
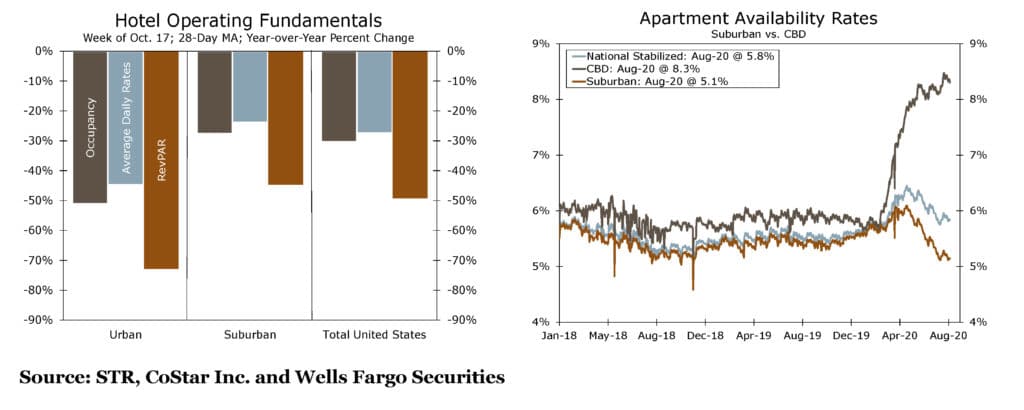
Hotel fundamentals have been devastated across the board, as reduced travel has diminished the demand. In urban office locations, the lack of routine business travel has pushed down occupancy by over 50 percent at the end of October. Revenue per available room (RevPAR) is down more than 70 percent. RevPAR is a key financial metric for hotels.
Apartments saw a slight uptick in vacancy rates at the end of April but occupancy has been increasing steadily since then, except for urban multi-family properties. While the average availability of units for all stabilized multi-family properties was 5.8 percent nationally at the end of October (and was 5.1 percent for suburban apartments), availability in CBD apartments climbed to 8.3 percent. Downtown apartments have been attractive to renters who worked in the CBD office for their proximity. That attraction has also been reflected in higher rents. With CBD office occupancy down, CBD renters are choosing to seek out cheaper suburban apartments from which to work from home.
A flurry of economic reports released since Thanksgiving showed how delicate the economic situation was as 2020 wound down. Unemployment claims continued to rise during the previous week, with nearly 21 million people remaining on soon-to-expire unemployment insurance. Data from various job posting sources suggested that the job creation numbers could turn negative in December. The slowdown in hiring and resurgence of COVID-19 brought household income down 0.7 percent in October, according to the Commerce Department. Consumer spending, however, increased by 0.5 percent, which was better than expected.
Factory orders rose one percent in October, according to the Commerce Department’s December 4 report. That followed an increase of 1.3 percent in September. Durable goods orders jumped 1.3 percent in October, while orders for consumable goods rose 0.7 percent.
The Institute for Supply Management (ISM) released its last reports before New Year’s on November’s Purchasing Managers’ Index (PMI) for manufacturing and non-manufacturing industries (NMI). The manufacturing index fell slightly in November to 57.5 percent. Within the PMI, the sub-indexes reflected the state of the overall economy, as business activity continued recovering while employment lagged. New Orders Index was 65.1 percent and Production Index was 60.8 percent, while the Employment Index fell to 48.4.
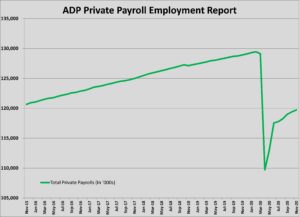
Reports on hiring echoed the falling ISM Employment Index. Payroll processing giant ADP reported that November private payrolls increased by 307,000 in November, a further slowing from October’s 365,000 increase in jobs. The December 9 Job Openings and Labor Turnover Survey (JOLTS) found that openings edged up slightly in October, but layoffs left 1.63 people unemployed for every job opening. The November Employment Situation Summary showed employers adding 245,000 jobs, a further slowing of the pace of the labor market recovery that was not unexpected.
Breaking down that December 4 jobs report below the headline, there are still disconcerting trends. Most concerning is the dip in the labor participation rate to 61.5 percent. That is nearly two percentage points, or six million people, fewer in the workforce than in February. The decline in the unemployment rate to 6.7 percent is more attributable to that decline in participation than job growth. The number of people on temporary layoff decreased again by 441,000 people, but the number of permanently unemployed remains unchanged and is 2.5 million higher than in February 2020. That stubbornly high long-term unemployment rate underscores the need for a continuation of unemployment benefits until the threat of pandemic recedes.
At the same time, the data from the construction industry continues to improve. New home sales maintained the torrid pace that had been set in the summer, with 990,000 new construction units sold in October, a 41.5 percent increase over the previous year’s total. Nearly 40 percent of those sales were for homes that were not yet under construction. That reduced the inventory of homes under construction to a 3.3 month supply. Without a surge in new construction in the coming months – something that will be difficult in cold-weather regions – the pace of new home sales will become impossible to sustain because of inadequate supply.
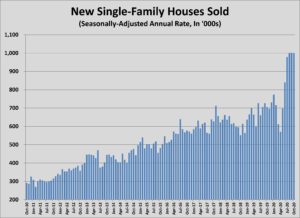
Sales of new homes soared in summer and fall to levels not experienced since September 2006. Source: U.S. Bureau of Census.
Residential construction lifted total construction spending 1.3 percent from September to October, according to the December 1 report from the Census Bureau. Construction spending was $1.44 trillion in October, an increase of 3.7 percent compared to October 2019. Private residential spending was up a whopping 14.2 percent year-over-year, while total nonresidential construction declined by 3.7 percent during the same period.
Private nonresidential construction spending declined 0.7 percent from September to October, with decreases in nine out of 11 categories. The October total was 8.2 percent lower than in October 2019. Construction of commercial buildings – offices, warehouses, and retail – declined by one percent. Public construction spending increased 1.0 percent in October and 3.7 percent year-over-year.
Construction lags the economy, so the relatively mild decline in nonresidential construction in 2020 may only be an indicator of a slower 2021; however, the 2020 recession was the result of a short-lived event rather than an imbalance in the economy. The four-month recession occurred in an environment that had regulatory guard rails for the lenders, which kept those institutions strong heading into 2021. Government response has been uncertain since summer but the CARES Act provided a bridge that staved off individual and business financial disasters to a greater degree than in 2009 or 2001, for example. Following a “normal” downturn, you could expect the second year to be the trough for construction. The current conditions suggest that result is less likely this business cycle.
In the final analysis, the recovery of the economy rests on a medical solution unlocking the confidence of the average consumer to return to pre-COVID habits. Assuming that confidence in public safety grows as the vaccine is delivered in the first months of 2021, the pace of recovery will be determined by the capital available to deploy. For businesses and investors, the health of the stock market and poor yields on cash means that there will be ample capital to put to work. The low cost of borrowing should be an incentive that also reduces the risk of developing early in the recovery, rather than after demand has returned. That bodes well for the construction and real estate markets.
For the majority of the economy, the health of the consumer is paramount. It will take at least six months after a vaccine is initiated to judge the state of the household balance sheet. But, in the meantime, one measure of financial health points to a strong post-COVID recovery. Among the few upsides to the efforts to mitigate the community spread of COVID-19 was the increase in savings for households that did not experience layoffs or reduced incomes. Including the virus relief packages from spring/summer, consumers added more than $2 trillion to their savings from February to year’s end. That’s equivalent to 11 percent of the annualized GDP at the end of the third quarter of 2020. Such a cache of cash will be an enormous source of fuel to drive economic recovery by mid-2021.
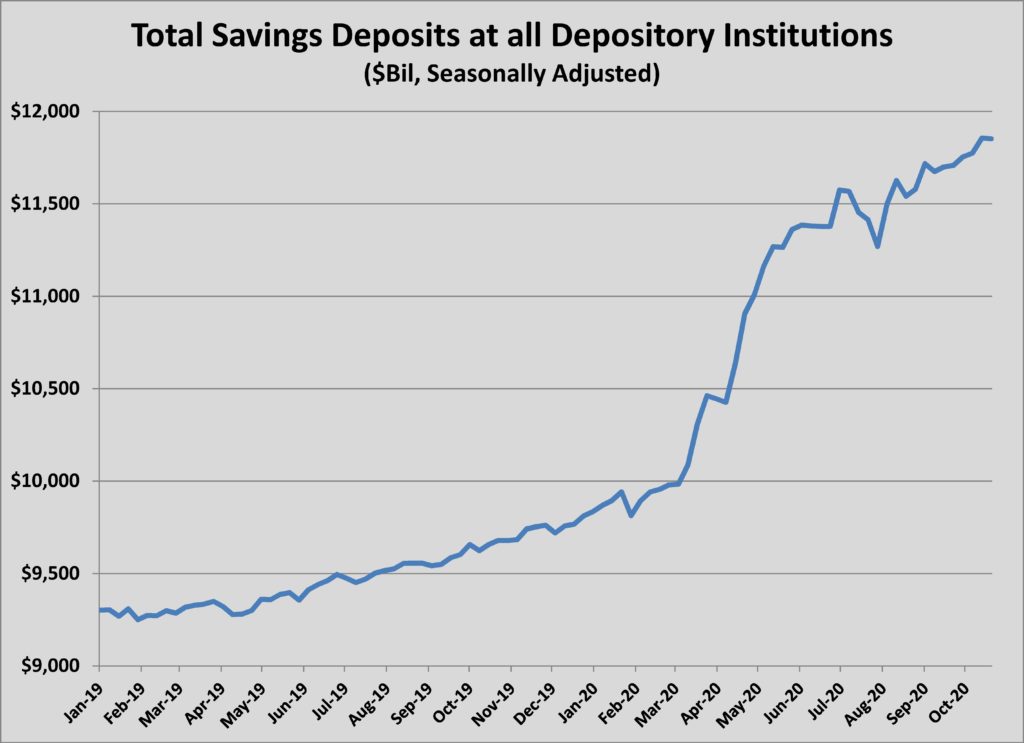
The huge jump in personal savings that occurred as a result of the COVID-19 relief and dampened demand represents dry powder for recovery in 2021. Source: Federal Reserve Bank of St. Louis.